Have you ever wondered what’s going on deep inside the Earth, 100’s km beneath your feet? This article looks at how geoscientists see inside our planet, the new things they are learning from cutting-edge research and what implications the Earth’s internal dynamics have for us at the surface.
Crust, mantle, outer core, inner core – the basic layered structure of the Earth is a familiar picture, Figure 1. But how do we actually know this is what the inside of the Earth looks like? And is it really that simple? Unfortunately, going there is not an option, the deepest hole ever drilled is only 12km deep (0.2% of Earth’s radius)! Luckily, geoscientists have a secret weapon up their sleeves – seismic waves!
Seismic waves are vibrations which travel through the Earth, produced by explosions, waves in the sea, or even cars and the movement of people. For imaging the Earth, the strong waves generated by earthquakes are the most useful to geoscientists.
The major layers of the Earth were all discovered by observing seismic waves that bounce off them (reflect) (side note1). This is similar to how medical ultra-sound imaging works. However, the structure of the deep Earth is a lot more complicated and detailed than the simple layered structure we’re used to thinking about. One way to see the details within the Earth’s layers is to use a technique called seismic tomography, which allows us to make 3D pictures of the inside of the Earth.
How does seismic tomography work?
Imagine an earthquake: the ground in the area shakes, and seismic waves are released in all directions into the Earth (figure 2A). They travel through the deep Earth, and eventually re-emerge at the surface, where they are recorded by sensitive instruments that measure the shaking of the ground (seismometers).
The time that the seismic waves arrive at each seismometer depends on the distance from the earthquake source to the seismometer, and the speed the wave travelled at. For each earthquake and seismometer combination, we can predict what time the wave should arrive, assuming we know how fast it travels through the Earth (using a simple, layered reference model, figure 2B). We then compare the actual time it arrives to when we thought it would – if it arrived later than expected then we know it passed through slower material than we thought was there, and vice versa.
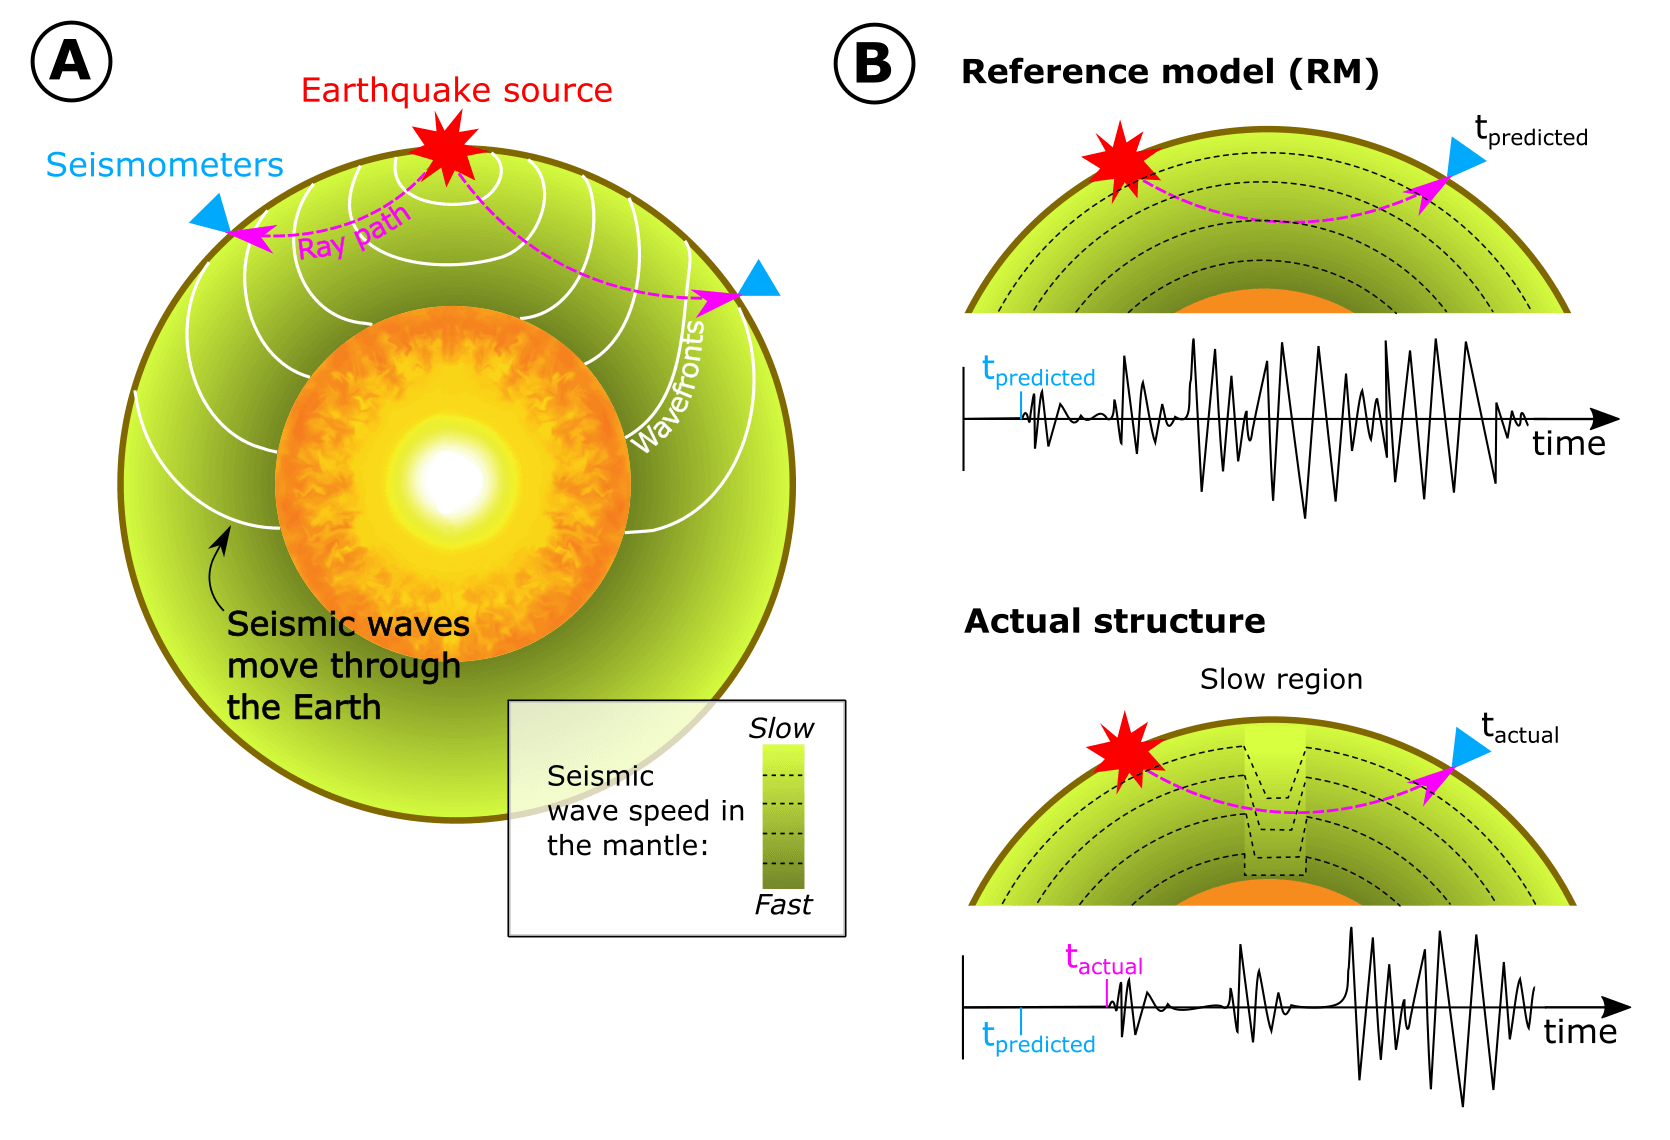
Figure 2 – A) Seismic waves spreading through the Earth. B) Comparison of the arrival time predicted by a layered reference model for seismic waves speed in the Earth, and the actual arrival time where the ray path passes through a slow region. The wiggly lines are examples of seismograms (predicted and actual)
Enormous amounts of these time-delay measurements (from thousands of earthquakes, each detected by many seismometers) are combined to make a 3D image of how the speed of seismic waves varies within the Earth in a seismic tomographic model (Figure 3). This technique is similar to a medial CT scan (computer tomography), where x-rays are taken from many different directions around the patient, and then combined to make a 3D image of inside the body.
Understanding what these pictures of seismic wave speed mean for what is going on deep inside the Earth is quite difficult, because wave speed is affected by lots of things, but it’s generally agreed that the most important factor is temperature. When solids are hot, their particles are further apart and move around faster, which means that it takes longer to pass a vibration between them. So we think the slow bits in our images probably show hot material, and fast bits show cold material.
What can we see inside the mantle?
One of the features we can see in tomographic images of the mantle are columns of hot material (mantle plumes, figure 4B), and sheets of cold material (subducting tectonic plates, figure 4A). The effect of temperature on density means that these warmer regions are rising up, and colder areas are sinking down into the solid mantle through the process of convection (side note 3). What’s even cooler, is that it’s possible to see the effects of mantle convection at Earth’s surface!
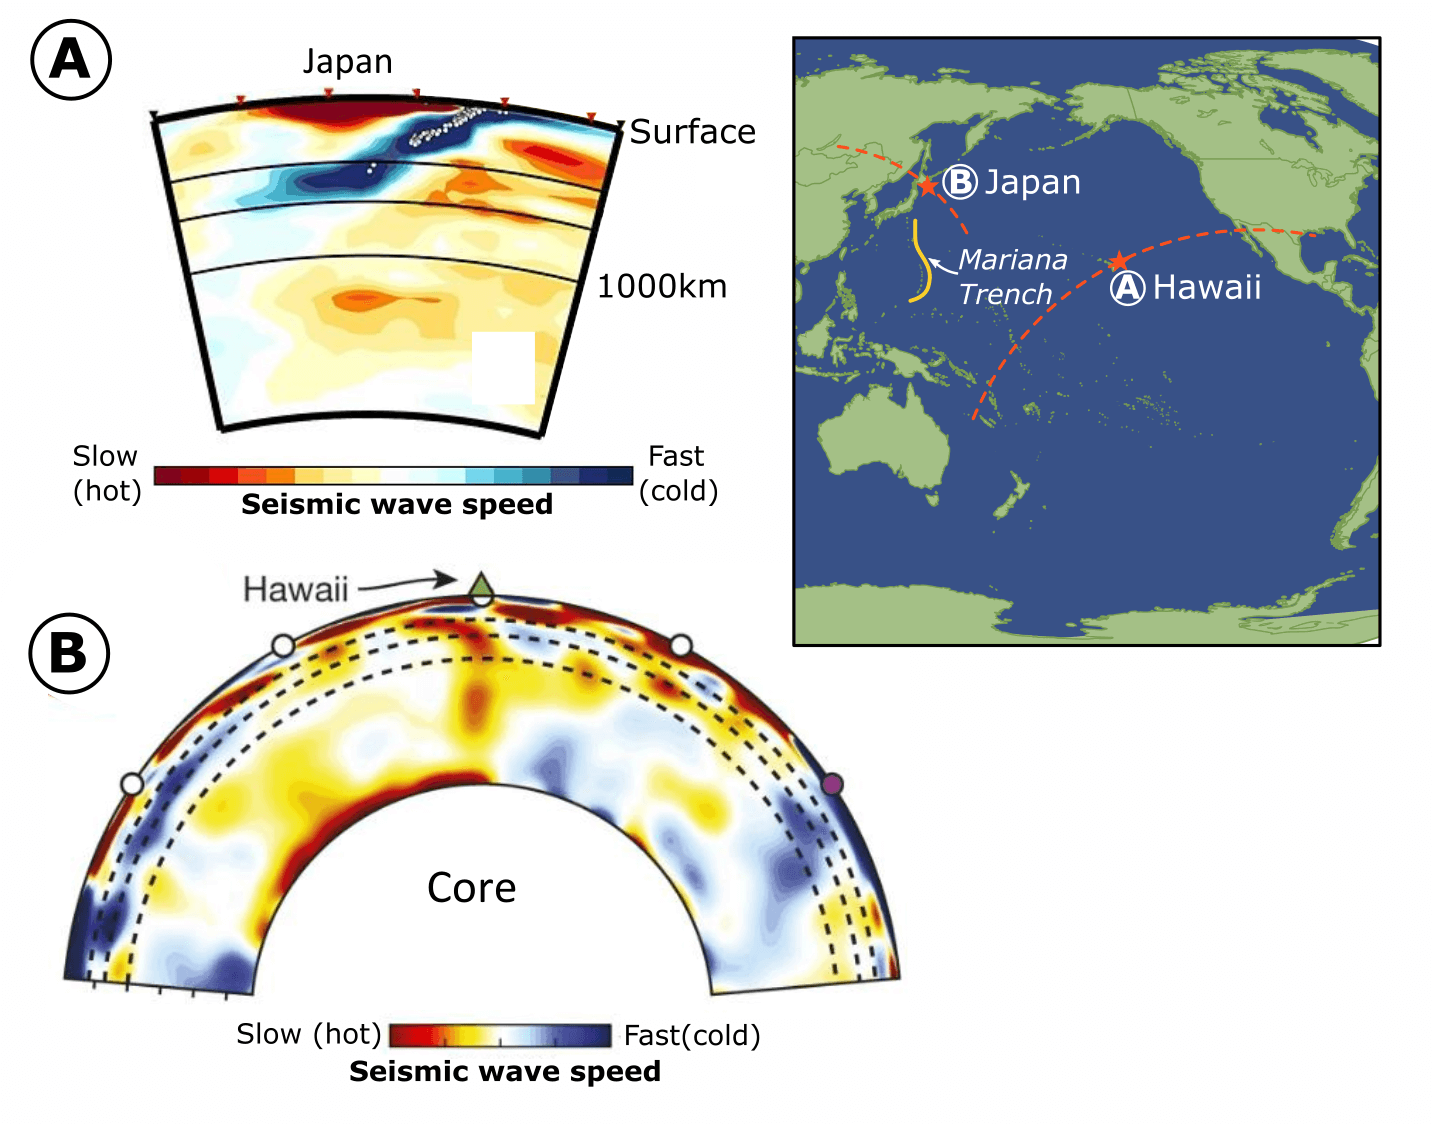
Figure 4- Tomographic 2D slices through the Earth. A) A mantle plume below Hawaii from French and Romanowicz (2015). B) A subducting tectonic plate below Japan from Fukao and Obayashi (2013)
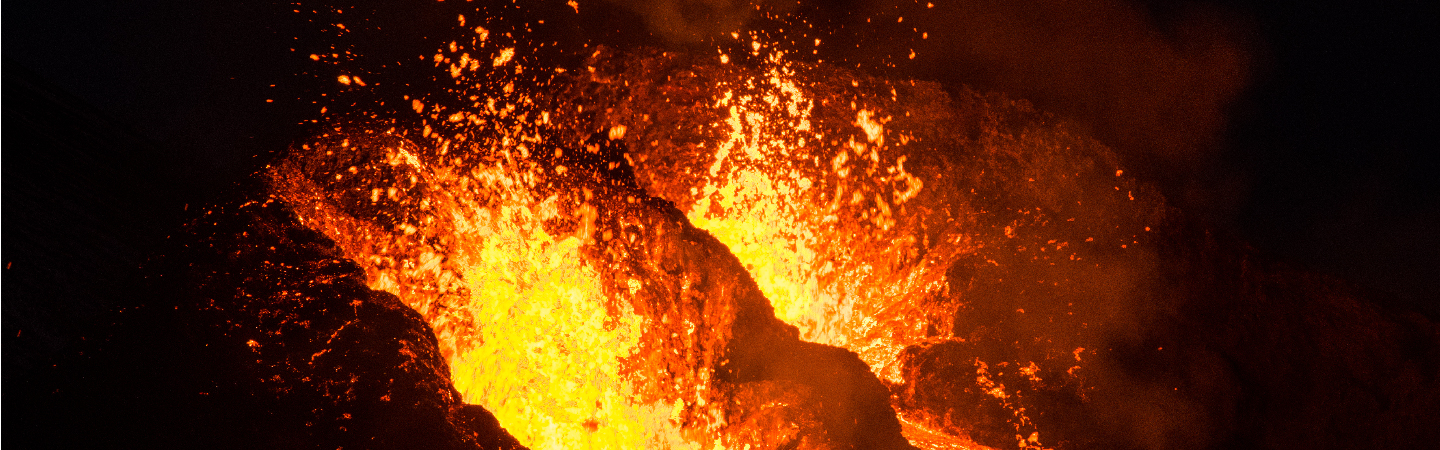
As hot mantle rises up in mantle plumes some of it melts because of the unusually high temperature, forming magma. This rises through the Earth’s crust and erupts at the surface forming volcanoes like Hawaii. Because of the movement of Earth’s tectonic plates over the stationary mantle plume below, a long line of volcanoes is produced over time.
Where tectonic plates collide and one sinks down beneath the other into the mantle below, we see submarine trenches on the Earth’s surface. The deepest of these is the Mariana trench, south of Japan, which marks the deepest place in the worlds’ oceans (11,034 m beneath the sea surface!).
Submarine trenches host unique marine ecosystems, living at extremely high pressures with low nutrient input and no light. Inside the Earth the shallower parts of down-going tectonic plates (down to 600km depth) produce lots of earthquakes (you can see them as tiny white dots on figure 2B), including some of the biggest in the world, such as the magnitude 9 2011 Tohoku earthquake in Japan which caused a tsunami and nuclear power plant meltdown.
Where are we at today?
More seismometers and better computers are slowly allowing us to see smaller and smaller structures and add more detail to our picture of what the Earth looks like inside. This means we are still discovering new things we don’t yet fully understand…
For example, tomographic images show two huge “mountains” of slow material at the bottom of the mantle, sitting on top of the outer core. These are called “large low velocity provinces” or LLVPs for short (Figure 1), and no one really knows quite what they are. Scientists argue about why they have slow seismic wave speeds; normally this would mean they are warmer than their surroundings, but then we would expect them to be buoyant and rise upwards. Instead they seem to be stable – sitting on top of the outer core for long time periods. Are they perhaps instead made of a different material to the rest of the mantle? It seems like LLVPs might be very important, changing how much heat can escape from the core (which could affect the Earth’s magnetic field which is generated there), and maybe controlling the location of where hot plume upwellings that create volcanoes on the surface can form…
LLVPs are just one of the many mysterious structures we are still trying to understand. What we really need is more data, and more geoscientists to find new ways to work out what these structures are. There is still much more to learn about what our planet looks like inside and how it works!
![]()
References
• Fukao, Y. and Obayashi, M., 2013. Subducted slabs stagnant above, penetrating through, and trapped below the 660 km discontinuity. Journal of Geophysical Research: Solid Earth, 118(11), pp.5920-5938. https://agupubs.onlinelibrary.wiley.com/doi/pdf/10.1002/2013JB010466
• French, S.W. and Romanowicz, B., 2015. Broad plumes rooted at the base of the Earth’s mantle beneath major hotspots. Nature, 525(7567), pp.95-99. https://www.nature.com/articles/nature14876
Hero Bain
Geosciences master's student, University of Cambridge

Dr. Jenny Jenkins MESci, PhD
Assistant Professor Earth Science, Durham University

Download PDF
If you wish to save, or print, this article please use this pdf version »
Learning resource
We have created learning notes to assist students and educators to further investigate the topics covered in this article. You can download the learning resource here »
